How to Review Your Fishing Season: 10 Questions to Ask Your Log Before Next Year
 Hudson Reed
Written by Hudson Reed
Total fish caught for the year is the most useless number in your fishing log, and it's the one everybody checks first. It tells you nothing about where you wasted your Saturdays, which fly box you could've left in the truck, or why the same stretch of river that put 20 fish in the net in April gave you nothing in August. If you want to review your fishing season in a way that actually changes what you do in 2027, you need to ask the log better questions than "how many."
Below are the ten I'd ask. For each one I'll give you the number to pull, the spreadsheet formula that pulls it, and what the app version looks like. Then we'll turn the answers into three goals you can write on a sticky note and actually hit.
One rule before you start: do this with the log in front of you, not your memory. A season looks a lot better in hindsight than it did on the water. The log is what keeps you honest.
Before you review your fishing season: set up the sheet
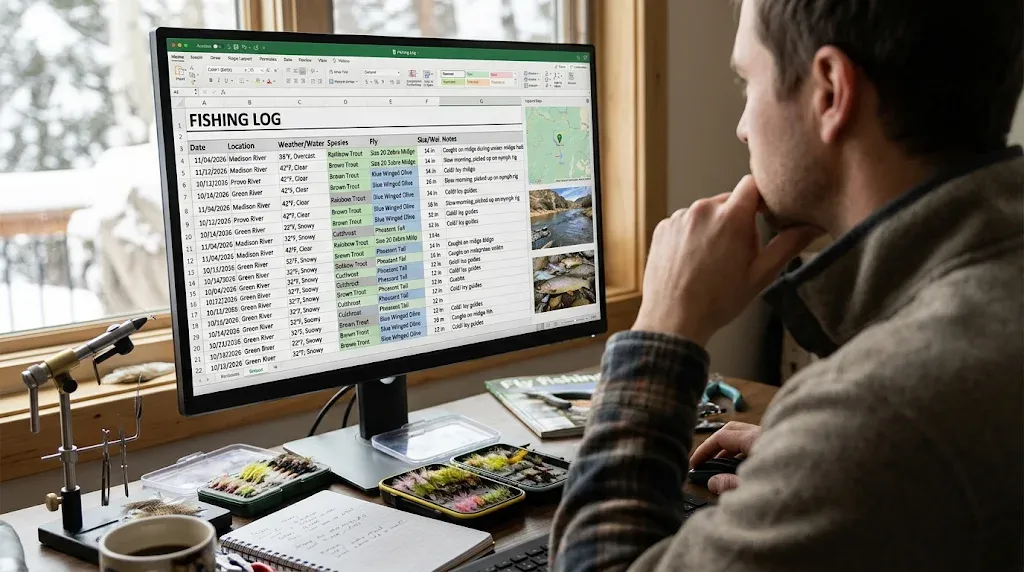
If your log lives in an app, skip this section. If it lives in a notebook or a spreadsheet, you need one row per trip with at least these columns: date, water, hours fished, fish count, species, lure or fly, max size, water temp, and a notes cell, in that order (columns A through I). Hours fished is the column people skip, and it's the one that makes half the questions below possible. Fish per hour is the number fisheries biologists actually use. Catch per unit effort, or CPUE, is how the Washington Department of Fish and Wildlife has reported volunteer angler catch rates going back to the 1990s, and it's the same math you'll run on your own season.
Add two helper columns to the right: Skunk in column J with =IF(D2=0,1,0) and Month in column K with =TEXT(A2,"mmm") (fish count is column D in that layout). Every question below leans on those two cells. If you used our free fishing log template, the columns are already there.
Fewer than about 15 trips logged? Don't bother with the math. Read your notes column top to bottom instead and go straight to the goals section. Small-sample stats will lie to you.
1. How many trips got skunked, honestly?
Skunk rate is the baseline for everything else. Count the zero-fish trips, divide by total trips.
Sheet: =COUNTIF(D:D,0)/(COUNTA(A:A)-1) (the minus one drops the header row). App: the Bushwhack dashboard shows days fished against days skunked on the main page, so the rate is one glance.
What's normal? Depends completely on what you fish for and how hard the water is. The Danish citizen-science project Fangstjournalen, run out of the Technical University of Denmark, specifically asks anglers to "report blank trips" because the zeros are what make a catch-rate estimate valid. Your skunks aren't failures in the data. They're half the data.
We published the skunk percentage from a real fishing log on this blog. The overall number is a conversation starter. The useful part is where the zeros cluster, which is question two.
2. Which water skunked you most?
This is the question that changes behavior. Build a pivot table with Water in the rows, and in the values put count of Date (trips), sum of Fish, and sum of Skunk. Google's pivot table help page covers the three clicks. Divide skunk by trips for each water in a column next to the pivot.
Now sort by skunk rate, not by total fish.
Your most-fished water will almost always have the most total fish because you went there 22 times. That's not a good water, that's a habit. The water with 4 trips and 0 skunks is the one your log is quietly pointing at.
App: Bushwhack's best-location-by-season card already splits this by spring, summer, fall and winter, which matters because a water that skunks you in July might be your best bet in October.
Contrarian take: if a water has a skunk rate over 50% across six or more trips and no big fish to show for it, cut it from the 2027 plan entirely. Loyalty to a spot is how people lose whole seasons.
3. Which month did each species actually eat?
Not when you fished for them. When they ate. Pivot: Month in rows, Species in columns, sum of Fish in values. Then a second pivot with count of trips so you can see fish per trip per month, because 30 fish in June across 10 trips is worse than 18 fish in October across 3.
You might also enjoy: Best Rechargeable Hand Warmers for Ice Fishing (2026): What Survives a Full Day at Zero
Sheet shortcut for one species: =SUMIFS(D:D,E:E,"Brown Trout",K:K,"Oct")/COUNTIFS(E:E,"Brown Trout",K:K,"Oct") where E is species and K is your Month helper.
App: the species breakdown and monthly catch cards do this automatically, and the demo dashboard shows what three years of it looks like if you want to see the layout before logging anything.
The pattern that surprises most anglers here is how narrow the windows are. A species you "fish all summer" often has two or three weeks where the fish-per-trip number doubles. Those weeks go on the 2027 calendar first.
4. Which lures or flies produced, per hour thrown?
Everyone tallies fish per fly. Almost nobody tallies hours per fly, so the fly you tie on first every morning wins by default. If you can swing it, log the primary fly or lure for the trip and the hours it got, then compute fish per hour for each. Kevin Cochran at Texas Saltwater Fishing Magazine calls the duration-of-use and success rate of each lure the most useful data in a log, and also admits it is often impossible to track. He's right on both counts.
Sheet: =SUMIF(F:F,"Pheasant Tail",D:D)/SUMIF(F:F,"Pheasant Tail",C:C) with F as fly and C as hours. App: Bushwhack tracks fly stats, best fly by location, and best fly by species out of the box, so the question becomes "which fly, where" rather than just "which fly."
We published which flies caught the most trout across 193 logged fly fishing trips on this blog. Run the same count on your own box and read the bottom of the list, not the top: the patterns that rode along all season and produced nothing. The 2027 version of that box should be smaller.
5. What did your five best days have in common?
Sort the log by fish count, descending. Take the top five rows. Now look only at the condition columns: water temp, clarity, cloud cover, wind, barometric trend, moon, time of day.
Sheet: =AVERAGEIF(D:D,">="&LARGE(D:D,5),H:H) gives you the average water temp (column H) across your five best fish-count days. Compare it to =AVERAGE(H:H) for the season. A gap of a few degrees is a pattern. No gap means temp wasn't the lever this year.
Cochran makes one more point in that same article: water temperature matters most at the extremes. If your best days all sit in a tight band and your skunks sit outside it, you've just found the single most useful fact in your log.
App: this is the card Bushwhack calls golden conditions. It pulls weather and water data for each logged day and shows what lined up on your biggest-fish and most-fish days. You could do it by hand. You won't, in year three, which is the point.
6. Where and when did the big fish come from?
Separate question from "where did the most fish come from," and the answer is usually a different water. Filter to your top 10% by size (or just everything over whatever counts as big where you live) and run the same pivot by water and by month.
Sheet: =MAXIFS(G:G,B:B,"Weber River") for the biggest fish per water, with G as max size and B as water. For the "when," =COUNTIFS(G:G,">=18",K:K,"Oct").
App: big-fish conditions and big-fish water temp are separate cards from the catch-rate cards for exactly this reason.
If your big-fish water and your most-fish water are different, you've got a decision for 2027: are you after numbers or size? There's no wrong answer. There is a wrong answer to "both, every trip."
7. How much of your season was the same three spots?
Count distinct waters: =COUNTUNIQUE(B2:B200) in Google Sheets, or build a pivot by water in Excel and count its rows. Then from your pivot in question 2, add up trips at your top three waters and divide by total trips.
You might also enjoy: Muck Arctic Sport vs Baffin Impact vs Kamik NationPlus: Which Boot for Standing on Ice All Day
If that number is over 75%, your log can't teach you much about anywhere new, because there's nothing new in it. That's fine if the three spots are producing. It's a problem if question 2 just told you one of them is a 60% skunk.
This is where the exploration goal comes from later, and it's also the question I'd weight the least if you're a parent with four free Saturdays a year. Consistency on one water you know cold beats scattered trips to six you don't.
8. Did you fish the hours that actually produced?
If you logged start time or time of day, pivot it against fish per hour. Most logs show a clear best window and a lot of trips that started two hours after it.
Sheet: with a Time of Day column (morning, midday, evening), =SUMIF(L:L,"Evening",D:D)/SUMIF(L:L,"Evening",C:C). App: Bushwhack computes time of day from your logged time and surfaces a best-hour card.
The honest version of this answer is usually "no, because work." That's still worth knowing. If evenings are your window and you can only get out on weekend mornings, your 2027 plan should be about making mornings work (different water, different technique), not about chasing a window you can't fish.
9. What were you not writing down?
Run =COUNTBLANK(H2:H200) on every condition column. The column with the most blanks is the question you couldn't answer this year. If water temp is 70% empty, you can't run question 5. If hours is empty, you can't run 4 or 8.
Pick one field to fix for 2027 and only one. Logs die from too many columns, not too few. The rule that holds up: start with a one-line entry per trip and add fields only when a question you care about needs them.
App: this problem mostly goes away, since weather, air temperature, moon phase and barometric pressure get attached to each log automatically from the date and location. You still have to type the fly, the fish, and the water conditions.
10. What did last January's you say you'd do differently?
If you set goals last year, go find them. If you didn't, this is the question that makes you set them this year, because the honest answer to "what changed" with no written goal is almost always "nothing on purpose."
Score each old goal as hit, missed, or abandoned. Abandoned is the interesting one. A goal you quietly dropped in March was usually a goal that was really about what you thought you should want, not what you fish for. Don't carry it forward. Replace it.
Turning ten answers into three goals for 2027
Three, not ten. Each one should come straight out of a question above, and each one should have a number in it so next December you can score it.
- A fix goal, from questions 1, 2 and 9. Something your log says is costing you. "Cut the skunk rate on the lower river below 30%, or stop going." Or "log water temp on every trip so I can actually answer question 5 next year." One fix. Not three.
- An exploit goal, from questions 3, 5 and 6. Something that worked and that you underfished. "Six trips to the reservoir in the two weeks either side of ice-out." "Fish the 52-58 degree water temp window on purpose instead of by accident." This is the goal that produces the best season you've had, because it's the only one built on evidence that you already caught fish doing it.
- A stretch goal, from questions 7 and 8. Something new, sized honestly to your calendar. Three new waters. One new species. A technique you've been avoiding. If you want a ready-made menu, our list of 30 fishing challenges is built for exactly this slot.
Write the three down where you'll see them. Bushwhack has a goals feature that tracks progress against your logs as you add them, and you can see how the goals and dashboard cards fit together without an account. A note in your phone works too. The point is that it's written, measurable, and derived from your own data rather than from whatever the catalog cover is pushing this winter.
What to do when the review says the season was bad
It happens. A bad trip turns into a bad month, high water wipes out May, a work project eats September, the log is 40% skunks and the biggest fish was 13 inches. Run the ten questions anyway. A bad season with good data is the setup for a great one, because the gaps are obvious. The anglers who get stuck are the ones who had a bad year and no log, so 2027 starts from the same guesses as 2026 did.
And if the review says the season was good? Same ten questions. The exploit goal gets bigger and the fix goal gets smaller. You still write all three down.
Then close the spreadsheet, go tie flies, and start a fresh fishing log on January 1. The review next December is only as good as the rows you give it.
Get fishing tips in your inbox
New guides, seasonal tactics, and gear picks — about once a month, no spam.